

Shop floor management (SFM) is a structured system of daily leadership habits, visual tools, and clear communication routines. Frontline teams use this system to monitor, execute, and improve manufacturing work directly on the factory floor. Ultimately, its main goal is to align frontline work with strategic company goals. In addition, it detects operational problems in real time, standardizes shift conversations, and speeds up problem resolution. While traditional production planning focuses on scheduling materials, routing, and work orders before production begins, shop floor management governs what happens during live execution. Consequently, when teams implement it effectively, it transforms the factory floor from a reactive environment into a disciplined, data-driven operational engine.
1. What is Shop Floor Management? (Definition & Core Objectives)
Shop Floor Management (SFM) serves as the daily operational link connecting enterprise strategy to frontline execution. Starting from the Toyota Production System (TPS) and Lean manufacturing methods, SFM relies on physical presence at the actual workplace (Gemba), immediate visual feedback, and disciplined meeting schedules. Consequently, these practices help teams eliminate operational waste (Muda).
+-----------------------------------------------------------------------+
|                       SHOP FLOOR MANAGEMENT (SFM)                      |
|                                                                       |
|  +------------------+   +-------------------+   +------------------+  |
|  |   Gemba Walks    |   | Tiered Meetings   |   | Visual Boards    |  |
|  | (Go & See Floor) |   | (L1 -> L2 -> L3)  |   | (SQCDP Metrics)  |  |
|  +--------+---------+   +---------+---------+   +--------+---------+  |
|           |                       |                      |            |
|           +-----------------------+----------------------+            |
|                                   |                                   |
|                                   v                                   |
|                     +---------------------------+                     |
|                     | Real-Time Anomaly Tracking |                     |
|                     +-------------+-------------+                     |
|                                   |                                   |
|                                   v                                   |
|                     +---------------------------+                     |
|                     | Standardized Escalation   |                     |
|                     +-------------+-------------+                     |
|                                   |                                   |
|                                   v                                   |
|                     +---------------------------+                     |
|                     |  Continuous Improvement   |                     |
|                     |      (Kaizen / PDCA)      |                     |
|                     +---------------------------+                     |
+-----------------------------------------------------------------------+
SFM vs. Shop Floor Control (SFC)
Many leaders confuse Shop Floor Management with Shop Floor Control. Although both systems are vital to modern manufacturing, they focus on different operational goals:
| Operational Dimension | Shop Floor Control (SFC) | Shop Floor Management (SFM) |
| Primary Focus | Order tracking, job dispatching, and work routing. | People, performance, problem-solving, and safety culture. |
| System Orientation | Transactional & software-centric (ERP/MES). | Behavioral, visual, and leadership-centric. |
| Core Output | Work-in-progress (WIP) tracking & schedule adherence. | Downtime reduction, waste elimination, & team alignment. |
| Primary User | Production schedulers & system planners. | Shift supervisors, line operators, & plant managers. |
| Cadence | Continuous transactional logging. | Structured daily, shift-level, and hourly huddles. |
By combining Shop Floor Control systems with strong Shop Floor Management practices—often integrated through Manufacturing Execution Systems (MES)—manufacturers ensure that software tracks job schedules while active frontline teams remove operational roadblocks immediately.
2. The 5 Pillars of Shop Floor Management (The SQCDP Framework)
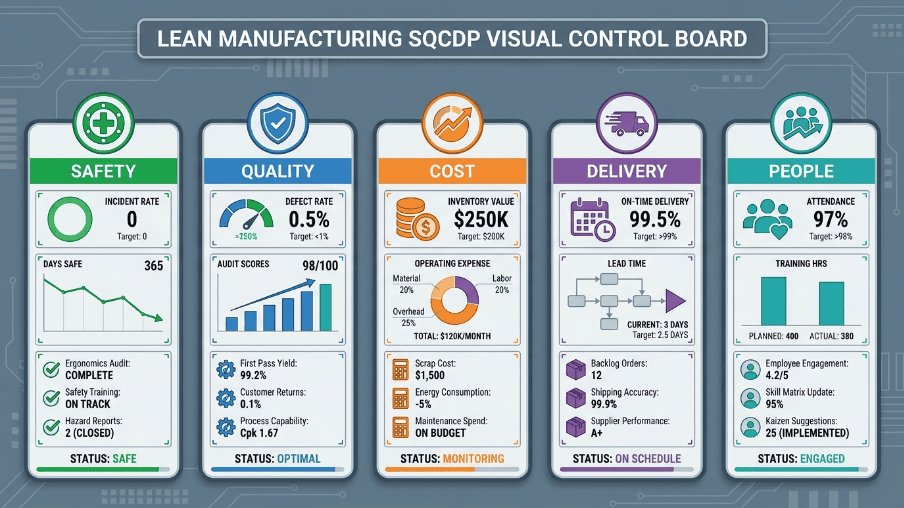
Effective shop floor management requires a balanced visual tracking framework. In particular, the global industry standard is the SQCDP model, which categorizes operational priorities into five distinct pillars: Safety, Quality, Cost, Delivery, and People.
+-----------------------------------------------------------------------+
|                        THE SQCDP BOARD LAYOUT                         |
+-------------------+-------------------+-------------------------------+
| SAFETY            | QUALITY           | COST                          |
| - Near-Miss Logs  | - First Pass Yield| - OEE %                       |
| - Days Without    | - Scrap Count     | - Unplanned Downtime (Mins)   |
|   Incident        | - Rework Hours    | - Scrap Cost ($/€/DKK)        |
+-------------------+-------------------+-------------------------------+
| DELIVERY                              | PEOPLE                        |
| - Hourly Target vs. Actual            | - Shift Attendance            |
| - On-Time In-Full (OTIF) %            | - Skill Matrix / Cross-Train  |
| - Takt Time Variance                  | - Operator Ideas Submitted    |
+---------------------------------------+-------------------------------+
1. Safety ($S$)
Safety is essential for every team. Indeed, without a safe working environment, long-term performance across all other operational metrics is impossible.
- Regional Compliance Context: In the United States, visual safety boards align directly with OSHA 1910 general industry guidelines and recordable incident logging requirements. Meanwhile, in Denmark and the European Union, safety metrics align with ISO 45001 Occupational Health and Safety standards and local statutory rules from the Danish Working Environment Authority (Arbejdstilsynet).
- Leading Metrics: Near-miss reports, 5S audit scores, and unsafe condition observations.
- Lagging Metrics: Lost Time Injury Frequency Rate (LTIFR), OSHA recordable incidents, and days since the last incident.
2. Quality ($Q$)
Quality management on the shop floor focuses on preventing defects at their source rather than detecting them during post-production quality control audits. Furthermore, this approach adheres directly to ISO 9001 Quality Management System standards.
- Key Metrics: First Pass Yield (FPY), scrap rate percentage, defect counts per line, rework hours, and Poka-Yoke (error-proofing) verification rates.
3. Cost ($C$)
On the shop floor, teams define “cost” in terms of resource efficiency, energy savings, and operational waste elimination (Muda).
- Key Metrics: Overall Equipment Effectiveness (OEE), Total Effective Equipment Performance (TEEP), scrap financial impact ($/€/DKK), unplanned downtime financial loss, and energy use per unit.
4. Delivery ($D$)
Delivery measures the team’s ability to maintain pace with customer demand (takt time) and meet production schedule commitments consistently.
- Key Metrics: Hourly production output (Target vs. Actual), On-Time In-Full (OTIF) completion rate, and cycle time variance relative to takt time.
5. People ($P$)
The people pillar measures workforce stability, ergonomic health, team skill coverage, and operational engagement.
- Key Metrics: Shift attendance, cross-training skill matrix percentages, and continuous improvement (Kaizen) ideas submitted per operator.
3. Sector-Specific Adaptations of SFM
Shop floor management is not a static framework. Therefore, implementing SFM successfully requires tailoring visual boards, meeting schedules, and metrics to your specific production model:
| Operating Environment | Operational Focus | Primary SQCDP Adaptation | Key Metric Shifts |
| High-Volume Discrete Assembly (Automotive, Consumer Electronics) | Line balancing, takt-time pacing, rapid defect containment | Hourly Target vs. Actual boards at every work cell | Takt time variance, Poka-Yoke verification, Line stop duration |
| Continuous / Process Manufacturing (Chemicals, Food & Beverage) | Flow consistency, batch yields, process parameter monitoring | Temperature, pressure, and CIP (Clean-in-Place) visual tracking | Batch yield %, CIP changeover duration, Unplanned downtime |
| High-Mix, Low-Volume (HMLV) (Job Shops, Custom Machining) | Setup reduction, queue management, work order flow | Job traveler boards, SMED tracking, order queue visualization | Changeover time (SMED), Queue time per job, Schedule adherence |
| Regulated Manufacturing (MedTech & Pharma in US/Denmark) | Audit trail integrity, compliance, cleanroom hygiene | Electronic Batch Records (eBR), environmental monitoring boards | Bio-burden compliance, Calibration adherence, Right-First-Time % |
4. Physical Board Ergonomics & Installation Standards
To maximize daily engagement and maintain safety compliance, maintenance teams must install physical visual boards according to strict ergonomic standards:
+-----------------------------------------------------------------------+
|                    PHYSICAL VISUAL BOARD STANDARDS                    |
|                                                                       |
|      [Board Top: ~2.0 meters / 78 inches]                             |
|      +---------------------------------------------------------+      |
|      |  SAFETY  |  QUALITY  |  COST  |  DELIVERY  |  PEOPLE  |      |
|      |                                                         |      |
|  = = | [Eye Level: 1.5 - 1.6 meters / 60 - 63 inches]          | = =  |
|      |                                                         |      |
|      +---------------------------------------------------------+      |
|      [Board Bottom: ~1.0 meter / 39 inches]                           |
|                                                                       |
|   <--------------------- Clearance Zone --------------------->        |
|   - Minimum 1.5m safe standing zone away from forklift traffic        |
|   - Illuminance: Minimum 500 lux at board face                         |
|   - Text Sizing: Main KPI headers >= 2.5 cm (1 inch) tall              |
+-----------------------------------------------------------------------+
- Positioning & Clearance: Mount boards within 5 meters of the primary work area. Specifically, keep them outside active forklift pathways while maintaining a 1.5-meter safe standing area for 6 to 10 team members.
- Ergonomic Height: Mount the center of the board 1.5 to 1.6 meters (60–63 inches) above the floor so operators on all shifts can read and write comfortably.
- Lighting & Typography: Ensure dedicated lighting provides at least 500 lux at the board surface. Additionally, use bold lettering at least 2.5 cm (1 inch) high for main metrics so workers can scan them clearly from 3 meters (10 feet) away.
5. The Daily Operating Rhythm: Gemba Walks & Leader Standard Work
Daily leadership habits drive successful shop floor management. Without a structured daily schedule, visual boards become static displays and operational accountability drops.
Standard Work for Leaders (LSW)
Leader Standard Work (LSW) defines the daily operational tasks that supervisors, team leaders, and plant managers must complete to maintain discipline. Instead of managing through reactive firefighting, leaders follow a structured shift schedule:
- **** Paid Shift Overlap & Pre-Shift Safety Briefing
- **** Tier 1 Standing Huddle at the SQCDP Board
- **** Morning Gemba Walk (Line Focus: Station 3 Bottleneck)
- **** Tier 2 Departmental Escalation Standup
- **** Root Cause Analysis Review (5-Why Session for Unplanned Downtime)
- **** End-of-Shift Handover Preparation & Log Verification
The Gemba Walk Protocol
A Gemba Walk (derived from the Japanese word Gemba, meaning “the real place”) is the practice where leaders go directly to the production line to observe work, engage with operators, and identify constraints.
To conduct an effective Gemba walk without creating friction with frontline workers, follow this 7-Point Observation Checklist:
- Observe the Process, Not the Person: Focus on process design, tool availability, and ergonomic challenges rather than criticizing individual operator speed.
- Verify Standard Work Compliance: Confirm whether the current Standard Operating Procedure (SOP) is visible, clear, and actively in use.
- Check Visual Controls: Ensure anyone standing 10 feet away can determine within 5 seconds whether the line is running on schedule.
- Identify the Bottleneck: Look for Work-in-Progress (WIP) accumulating ahead of a specific work center to determine what restricts throughput.
- Ask “Why” Before Offering Solutions: Engage operators with open coaching questions, such as: “What is causing the biggest friction at this station today?”
- Log Open Problems: Ensure the team logs every unresolved issue on the visual board with an assigned owner and target completion date.
- Close the Loop: Follow up within 24 hours on issues logged during previous walks to build credibility and trust.
6. The Tiered Meeting Cascade & Escalation SLA Matrix
Information on a factory floor must move quickly. Therefore, a tiered meeting system establishes a clear communication structure that moves issues from operators up to executive managers while delivering fast support back to the floor.
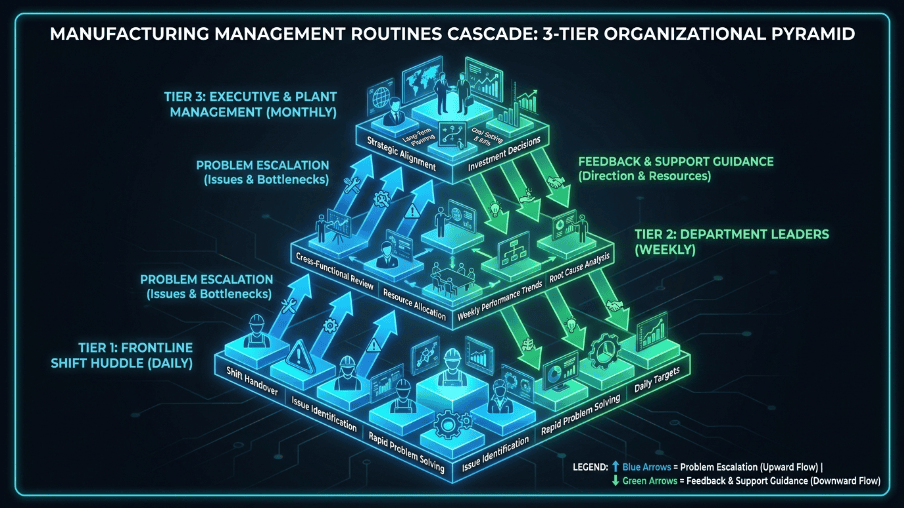
+-----------------------------------------------------------------------+
|                        TIERED MEETING CASCADE                         |
|                                                                       |
|  +-----------------------------------------------------------------+  |
|  | TIER 3: Executive & Plant Management (15-30 Mins Daily)        |  |
|  | Focus: Cross-departmental blockers, capital requests, trends    |  |
|  +--------------------------------^--------------------------------+  |
|                                   | Escalation / Guidance             |
|  +--------------------------------+--------------------------------+  |
|  | TIER 2: Department & Value Stream Leaders (10-15 Mins Daily)    |  |
|  | Focus: Cross-functional downtime, tooling, engineering support  |  |
|  +--------------------------------^--------------------------------+  |
|                                   | Escalation / Support              |
|  +--------------------------------+--------------------------------+  |
|  | TIER 1: Frontline Shift Huddle (5-8 Mins Start of Shift)        |  |
|  | Focus: Immediate SQCDP status, shift targets, safety issues     |  |
|  +-----------------------------------------------------------------+  |
+-----------------------------------------------------------------------+
Meeting Tier Breakdown
| Meeting Tier | Participants | Duration & Frequency | Primary Location | Focus & Output |
| Tier 1 | Shift Supervisor, Line Operators, Maintenance Tech | 5–8 minutes / Start of shift | Cell / Line SQCDP Board | Shift goals, immediate safety concerns, previous shift handovers, immediate downtime causes. |
| Tier 2 | Value Stream Manager, Supervisors, Engineering, Quality, Maintenance | 10–15 minutes / Daily (e.g., 09:00 AM) | Department Visual Board | Unresolved Tier 1 escalations, cross-functional roadblocks, daily OEE trends, resource allocation. |
| Tier 3 | Plant Manager, Department Heads (Ops, HR, EHS, Supply Chain) | 15–30 minutes / Daily (e.g., 10:30 AM) | Plant Performance Center | Strategic alignment, multi-line failures, major safety incidents, capital expenditure ($/€/DKK) escalations. |
The Escalation Service Level Agreement (SLA) Matrix
A major failure in manufacturing is the “black hole” effect—where operators write issues on whiteboards, but support teams take days to respond. Consequently, establishing an explicit Escalation SLA Matrix resolves this issue:
IF an anomaly occurs on the line:
├─ Operator attempts resolution (Limit: 15 minutes)
│  ├─ RESOLVED -> Resume production & log downtime reason.
│  └─ UNRESOLVED -> Shift Supervisor notified immediately.
│
├── Supervisor & Maintenance attempt resolution (Limit: 1 hour)
│   ├─ RESOLVED -> Resume production & log root cause.
│   └─ UNRESOLVED -> Issue escalated to TIER 2 meeting (Engineering/Quality assigned).
│
└── Tier 2 Team attempts resolution (Limit: 24 hours)
    ├─ RESOLVED -> Implement temporary countermeasure & PDCA cycle.
    └─ UNRESOLVED -> Issue escalated to TIER 3 (Plant Manager allocation / External Support).
- Tier 1 Escalation SLA: If an issue halts production for more than 15 minutes and operators cannot fix it, the team must log it on the Tier 1 board and request Tier 2 support.
- Tier 2 Escalation SLA: If an issue remains open after 4 hours or requires capital spending above set authorization limits (e.g., $1,000 / €1,000 / DKK 7,500), the team must escalate it to Tier 3.
- Tier 3 Escalation SLA: Plant leadership must assign an owner within 2 hours of a Tier 3 review and route daily progress updates back to the originating Tier 1 team board.
7. Shop Floor KPIs & Calculations: OEE, TEEP, & Takt Time
Tracking too many metrics creates confusion and reduces frontline focus. Therefore, key performance indicators must be mathematically sound, clearly defined, and directly actionable.
1. Overall Equipment Effectiveness (OEE) & TEEP
Seiichi Nakajima developed OEE in 1971 as part of Total Productive Maintenance (TPM). Specifically, OEE measures the percentage of planned manufacturing time that is truly productive. Total Effective Equipment Performance (TEEP) expands this scope by measuring performance against total available calendar hours (24/7/365).
$$\text{OEE} = \text{Availability} \times \text{Performance} \times \text{Quality}$$
$$\text{TEEP} = \text{OEE} \times \text{Capacity Utilization}$$
$$\text{Availability} = \frac{\text{Actual Operating Time}}{\text{Planned Production Time}}$$
$$\text{Performance} = \frac{\text{Total Units Produced} \times \text{Ideal Cycle Time}}{\text{Actual Operating Time}}$$
$$\text{Quality} = \frac{\text{Good Units Produced}}{\text{Total Units Started}}$$
$$\text{Capacity Utilization} = \frac{\text{Planned Production Time}}{\text{Total Available Time (24/7)}}$$
Worked Calculation Example:
A packaging line runs on a single scheduled 8-hour shift per day (480 minutes) with a 30-minute scheduled meal break. Thus, Planned Production Time equals 450 minutes.
First, calculate Availability. The line incurs 45 minutes of unplanned downtime, which leaves 405 minutes of Operating Time:
$$\text{Availability} = \frac{405}{450} = \mathbf{90.0\%}$$
Next, calculate Performance. The machine’s ideal speed is 10 units/min (Target: 4,050 units), but actual output reaches 3,442 units:
$$\text{Performance} = \frac{3,442}{4,050} = \mathbf{85.0\%}$$
Then, calculate Quality. Out of 3,442 units, workers scrap 103 units, which leaves 3,339 good units:
$$\text{Quality} = \frac{3,339}{3,442} = \mathbf{97.0\%}$$
Consequently, the overall OEE is:
$$\text{OEE} = 0.90 \times 0.85 \times 0.97 = \mathbf{74.2\%}$$
Finally, calculate TEEP. Because the plant runs 1 shift out of 3 possible shifts in a 24-hour day, Capacity Utilization equals $450 / 1,440 = 31.25\%$:
$$\text{TEEP} = 74.2\% \times 31.25\% = \mathbf{23.19\%}$$
2. Takt Time vs. Cycle Time
Pacing the floor requires matching actual operational speed (Cycle Time) with customer demand pace (Takt Time).
$$\text{Takt Time} = \frac{\text{Net Available Operating Time}}{\text{Customer Demand (Units Required)}}$$
For example, a line has 420 minutes of net operating time per shift, and customer demand requires 840 units per shift:
$$\text{Takt Time} = \frac{420 \text{ minutes} \times 60 \text{ seconds}}{840 \text{ units}} = \mathbf{30 \text{ seconds/unit}}$$
If the observed Cycle Time exceeds 30 seconds at any workstation, that station creates a line constraint that requires re-balancing or waste removal.
8. Analog vs. Digital SFM: The Maturity Roadmap
Facilities do not need to deploy complex technology on day one. In fact, digitizing inefficient processes usually speeds up failure. Deploying Digital SQCDP Boards becomes effective once frontline routine discipline is firmly established. Therefore, use this 4-Stage SFM Maturity Model to evaluate your plant’s readiness:
+-----------------------------------------------------------------------+
|                    SFM DIGITAL MATURITY ROADMAP                       |
|                                                                       |
|  STAGE 1: PAPER LOGS & CLIPBOARDS                                     |
|  - Manual shift sheets, high data lag, zero cross-line visibility.    |
|  - Risk: Lost paper, unreadable handwriting, reactive operations.     |
|                                                                       |
|  STAGE 2: PHYSICAL WHITEBOARDS (ANALOG LEAN)                          |
|  - SQCDP whiteboards, manual markers, daily Tier 1 huddles.           |
|  - Advantage: High team engagement, zero software cost.               |
|                                                                       |
|  STAGE 3: HYBRID DIGITAL VISUALIZATION                                |
|  - Large TV screens displaying digital dashboards, manual entry.      |
|  - Advantage: Centralized data, instant plant-wide metric sharing.    |
|                                                                       |
|  STAGE 4: REAL-TIME CONNECTED IIoT / DIGITAL SFM                      |
|  - Direct machine sensor connectivity, automated OEE tracking,        |
|    mobile tablet workflows, automated escalation triggers.            |
+-----------------------------------------------------------------------+
Digital SFM Software Selection Framework
When moving from Stage 2/3 whiteboards to Stage 4 connected digital platforms, evaluate software solutions against these key capabilities:
| Evaluation Criteria | Basic Dashboarding | Full Enterprise Digital SFM Platform |
| Data Ingestion | Manual spreadsheet / CSV upload | Native IIoT connectivity (OPC-UA, MQTT, REST APIs) |
| Escalation Triggers | Static email summaries | Automated push alerts (SMS, MS Teams) with SLA timers |
| Workstation Usability | Read-only TV display | Touchscreen operator interfaces with offline image capture |
| System Integration | Standalone visual layer | Bi-directional synchronization with ERP and MES work orders |
| Software Categories | Generic BI Tools (PowerBI, Tableau) | Connected Worker Platforms (Tulip, Siemens Opcenter, SAP DM) |
9. Change Management & Overcoming Operator Resistance
Introducing visual controls can trigger pushback if operators feel boards monitor or criticize them. Successful leaders reframe visual boards as tools that support operators, using structured coaching scripts to build trust.
Leadership Coaching Scripts
- Scenario A: Operator expresses skepticism about board tracking
- Operator: “Why are we wasting time writing downtime minutes on this board? Management just wants to watch us.”
- Leader Response: “This board is not here to track you—it is here to track the obstacles getting in your way. When you log that Station 2 waited 20 minutes for raw material, it gives me the exact data I need to hold Warehouse and Supply Chain accountable at the Tier 2 meeting. You log the issue; my job is to remove the roadblock.”
- Scenario B: Operator hesitates to report a quality error
- Operator: “I didn’t log the scrap count because it was just a minor setup adjustment error.”
- Leader Response: “We treat every logged error as a system lesson rather than a personal fault. If our setup process allows that error to happen, the process itself needs improvement. Logging it gives us the reason to install an error-proofing guide so nobody on any shift makes that mistake again.”
10. Step-by-Step SFM Implementation Strategy
Implementing shop floor management requires balancing process standardization with active change management. To achieve this, follow this 5-step execution plan:
Step 1: Standardize the Tier 1 Board & Area Layout
Select a single pilot production cell. Next, design a standardized physical or digital SQCDP board layout following ergonomic guidelines. Position the board directly at the start of the line with a 1.5-meter safe standing perimeter.
Step 2: Establish the Paid Shift Handover Protocol
Communication gaps during shift transitions drive startup downtime. Therefore, implement a mandatory 10-Minute Paid Shift Overlap & Handover Routine:
+-----------------------------------------------------------------------+
|                 10-MINUTE PAID SHIFT HANDOVER ROUTINE                 |
|                                                                       |
|  MINUTES 1-2: Safety & Cleanliness Joint Walk                         |
|  - Outgoing & incoming supervisors conduct joint 5S & safety walk.   |
|                                                                       |
|  MINUTES 3-4: Target vs. Actual Output Verification                   |
|  - Verify final production counts, scrap totals, and downtime logs.   |
|                                                                       |
|  MINUTES 5-6: Equipment & Asset Condition Check                       |
|  - Review running machine parameters, tooling wear, & maintenance.    |
|                                                                       |
|  MINUTES 7-8: Open Abnormalities & Ticket Review                      |
|  - Review pending Tier 1/Tier 2 escalation tickets & hot orders.      |
|                                                                       |
|  MINUTES 9-10: Handover Sign-off & Shift Launch                       |
|  - Formal log sign-off; incoming crew launches production.            |
+-----------------------------------------------------------------------+
Step 3: Train Leaders on Standard Work
Train supervisors to facilitate Tier 1 huddles within a strict 8-minute window. Tier 1 meetings focus on operational alignment rather than extended problem-solving. Consequently, teams must conduct complex root-cause investigations offline using structured 5-Why or Fishbone (Ishikawa) techniques.
Step 4: Institute the Escalation Cadence
Enforce daily attendance of engineering, maintenance, and quality managers at Tier 2 escalation standups. When operators see that cross-functional teams quickly solve issues logged on frontline boards, system adoption and trust increase significantly.
Step 5: Audit, Iterate, and Scale Digitization
Run the analog visual system for 60 to 90 days to solidify daily habits. Once shift huddles, Gemba walks, and escalation routines are fully established, evaluate digital SFM software to automate data capture and scale the framework across additional plants.
11. Frequently Asked Questions (FAQ)
- Q: What is the difference between Shop Floor Control (SFC) and Shop Floor Management (SFM)?
- A: Shop Floor Control (SFC) is an administrative software function focused on order dispatching, material tracking, and job routing (typically managed via ERP or MES software). In contrast, Shop Floor Management (SFM) is an operational leadership system focused on daily visual controls (SQCDP), shift huddles, Leader Standard Work, Gemba walks, and structured problem escalation.
- Q: How long should a Tier 1 shop floor huddle take?
- A: A Tier 1 meeting should take 5 to 8 minutes. In addition, teams must conduct it while standing at the line visual board. If an issue requires more than 2 minutes of discussion, the team should log it as an open problem and move it to an offline root cause analysis session.
- Q: Can Shop Floor Management succeed without digital software?
- A: Yes, absolutely. Classical SFM relies entirely on physical whiteboards, dry-erase markers, and printed status cards. In fact, implementing physical boards first builds operational discipline and team ownership before adding software complexity.
- Q: How do you address operator resistance to visual tracking boards?
- A: Resistance typically occurs when operators feel visual boards monitor or criticize them. To prevent this, frame the board as a support platform for operators. When management uses board data to fix reported obstacles quickly, frontline resistance turns into active support.
Shop floor management is far more than a set of visual boards or digital dashboards—it is the core operational discipline of high-performing manufacturing teams. By defining SQCDP visual pillars, maintaining structured Gemba walks, enforcing tight meeting schedules, and adhering to strict escalation SLAs, plants build a culture where teams identify problems immediately and solve them permanently.
Recommended Next Steps:
- Audit your shift handovers: Evaluate whether shift transitions follow a clear structure or depend on informal verbal conversations.
- Pilot one visual board: Install a standardized SQCDP board on a single bottleneck line following ergonomic height and safety guidelines.
- Commit to the daily rhythm: Enforce an 8-minute Tier 1 standup daily for 30 consecutive days before expanding the system across the facility.